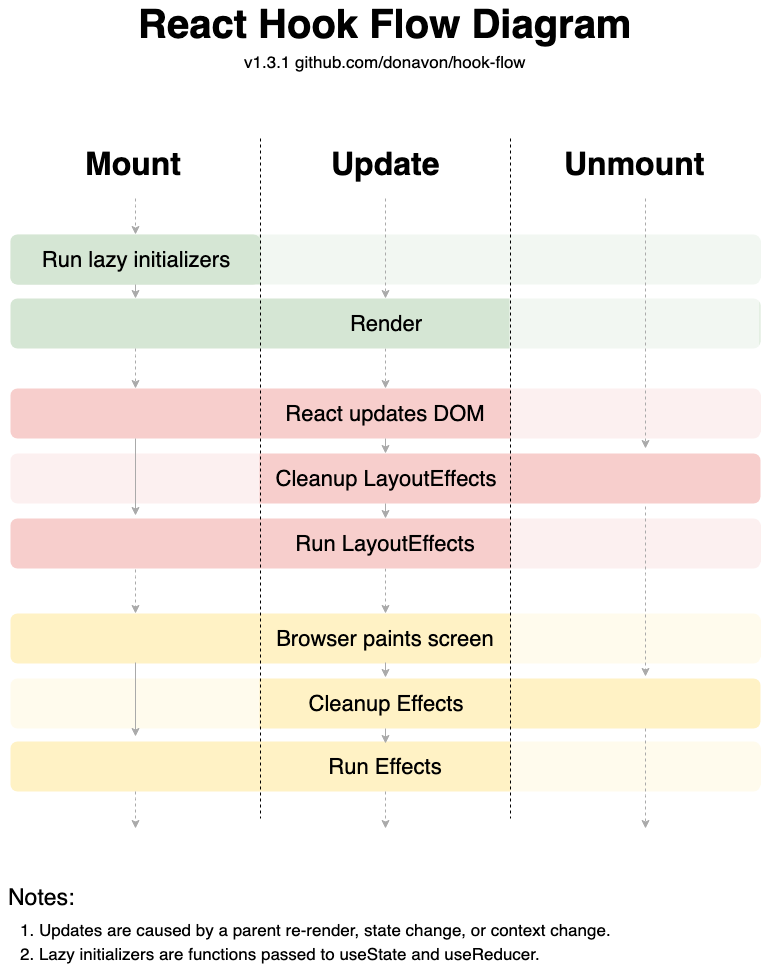
The chart above is from a famous tweet by Dan Abramov in 2018. Dan, as usual, does an amazing job of communicating his deep technical knowledge in a way that is easy to comprehend.
Since the release of Stately's Visual Editor, I've been using it more and more at my dayjob at Centered to construct new, and comprehend existing, state machines in our codebase. The visual editor is just so fun to use!
The other day, I thought to myself,
"I wonder if I could test my knowledge of React and state charts, and model the React lifecycle methods in a state chart?" 🤔
So I gave it a try!
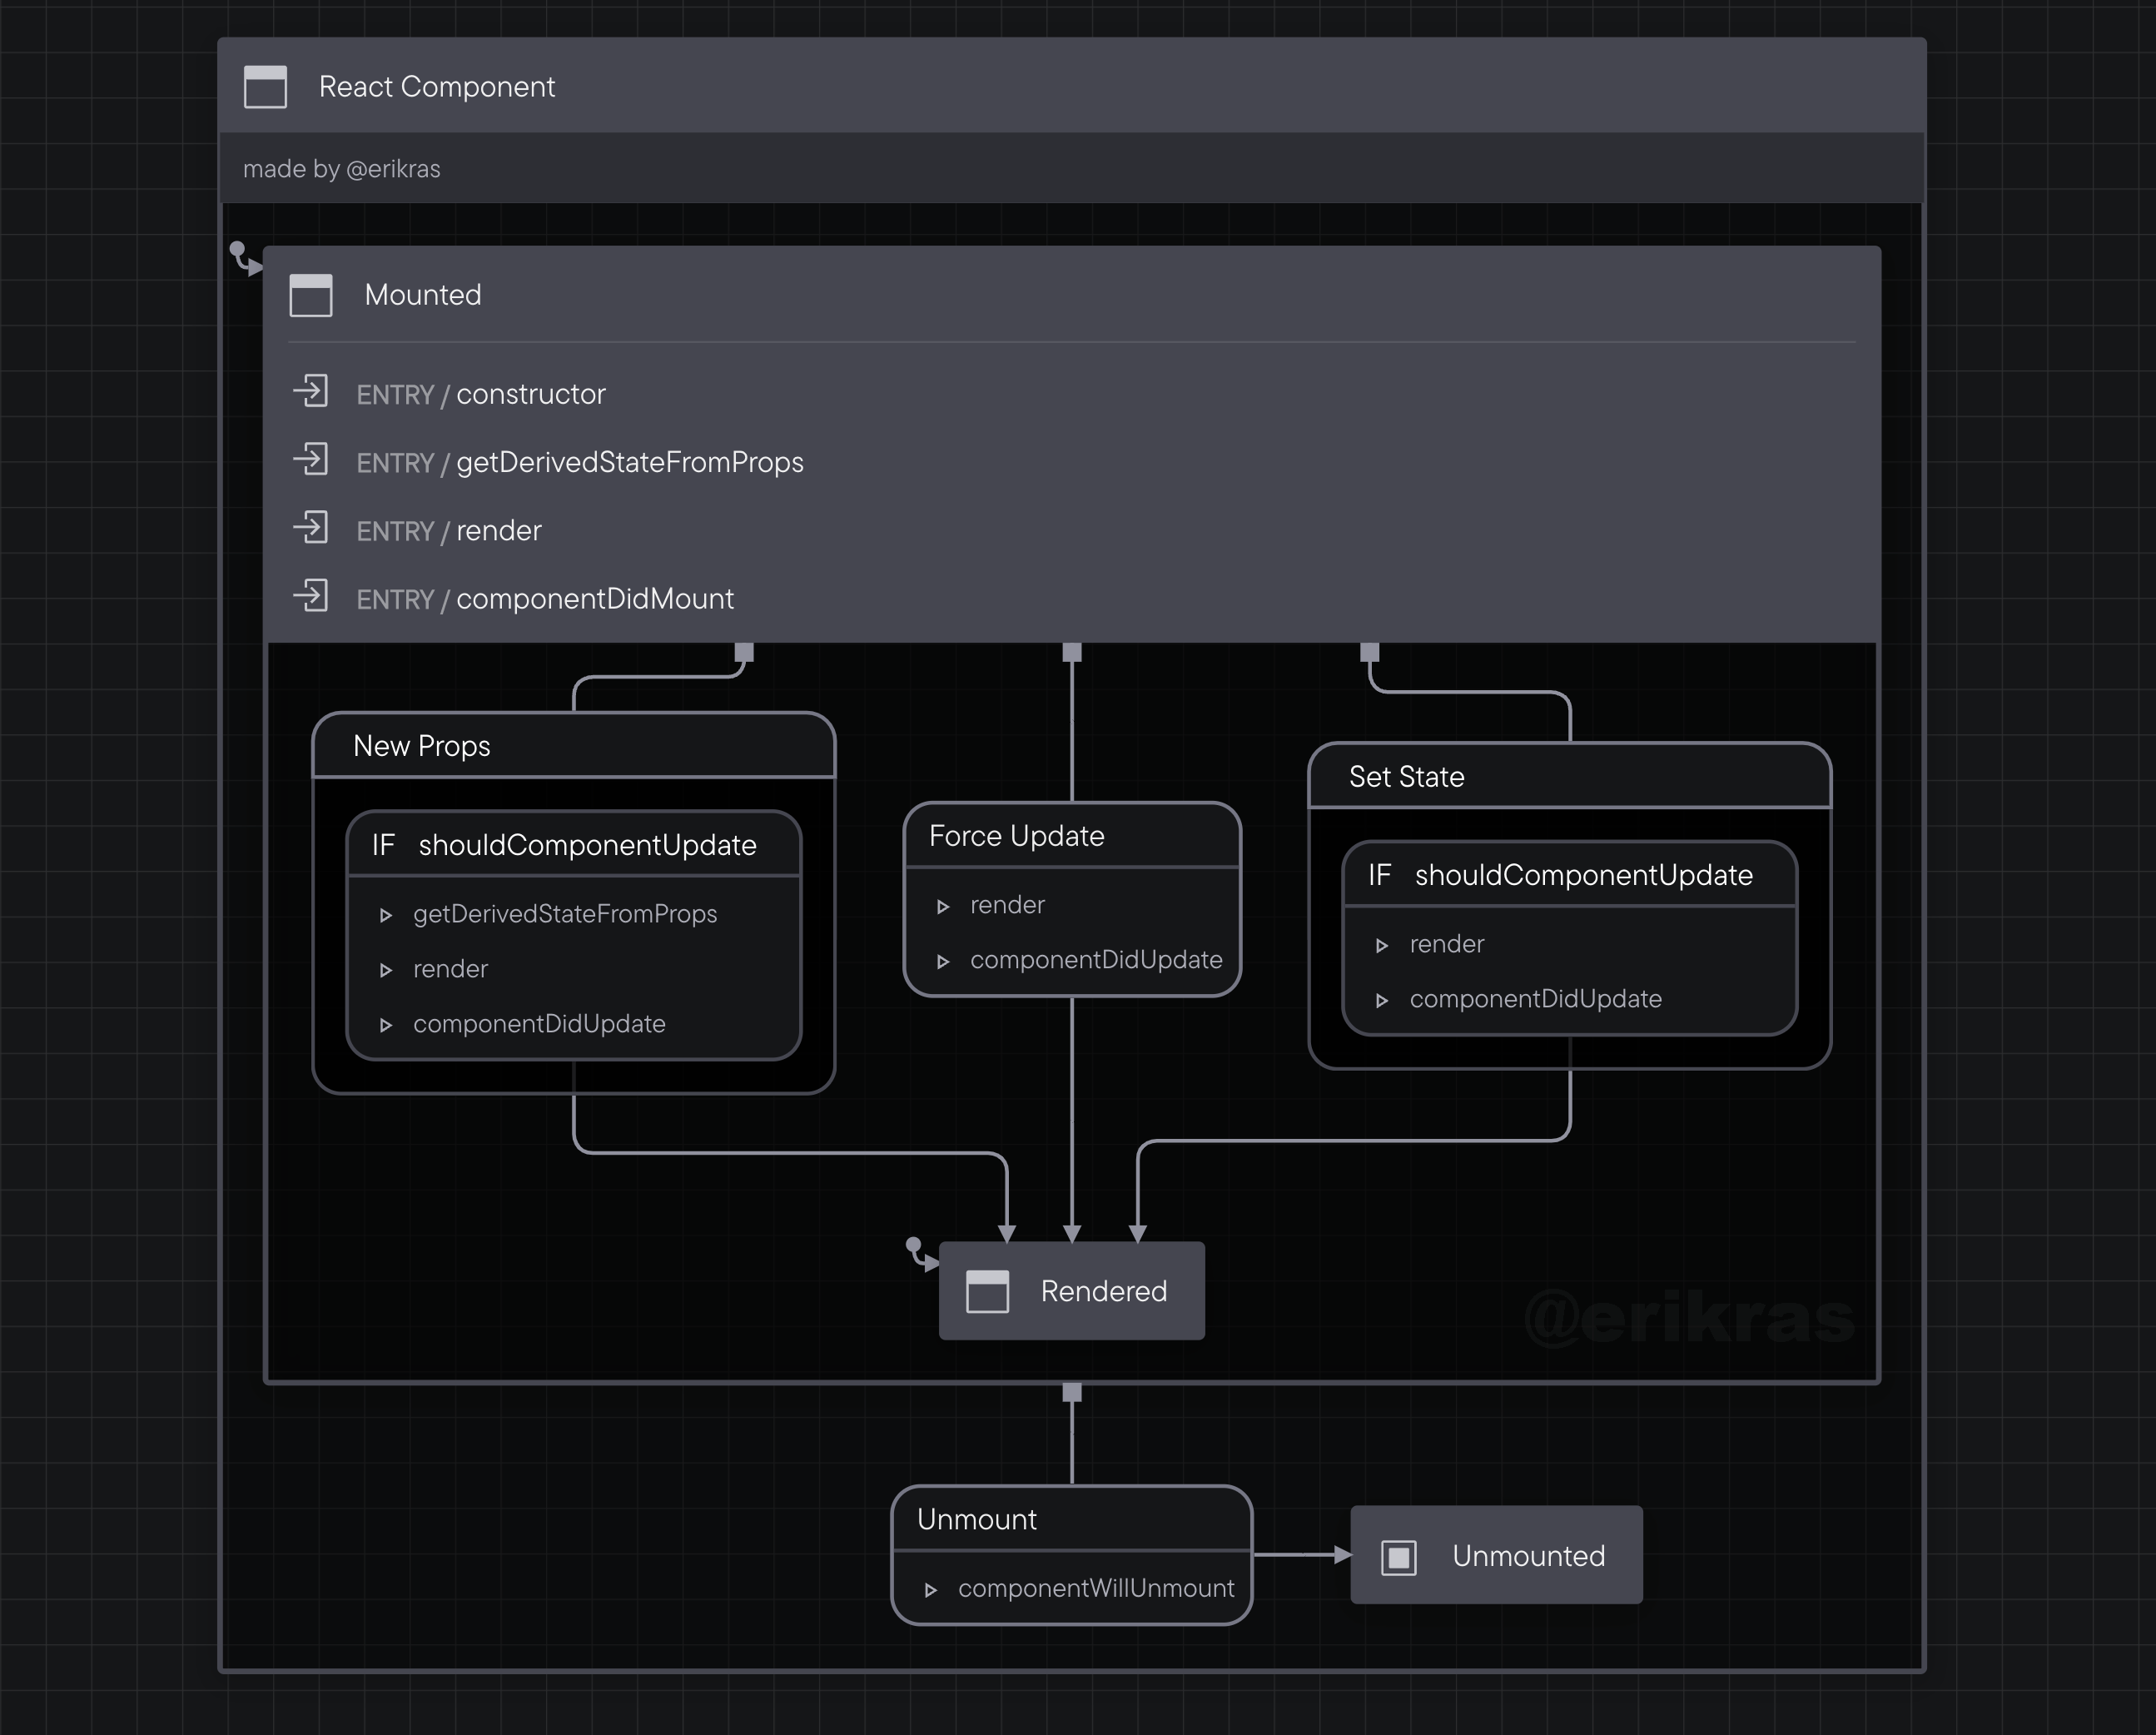
React Lifecycle State Chart

One thing that immediately jumped out at me was how all the lifecycle methods –
and render() itself! – ended up being side effects, or "actions" in XState
parlance. This makes total sense, as they really are where you put side
effects!
Rendering is a side effect!
The Code
This is the XState machine that the visual editor generated:
import { createMachine } from "xstate";export default /** @xstate-layout N4IgpgJg5mDOIC5QCUwEMDGAXABAYQHsBbABwIDsxysA6AWQIFdrIBiAVXKKesVDNgBLLIIp8QAD0QBaAIwAGAGw0ALAE4AHPICsigMxrFi+RqMAaEAE8ZAJhsaaAdm0qVsmyb12bamwF8-C1RMXEJSCipaBmYsNgA5MAB3HAAFACcCEngkEAFhUXJxKQRpNxsaeVk9FUc1Xz09DTttC2sS-WUG9wbtbUdXWUcAoPRsfGIySmp6HliIVgBlMFwFrDRY8TyRMRzi2SqaRTVHE3t+tS7HVplFDxofBUUVDQ1ZC5tZYZBgsbDJyJmMTYADECGkMGAcOwSBB1mBNgQhNtCrsZAp5DRZC4zvI9I4DPtriVtC8aGoVDZtLImoZHI4ngFAiByAQIHBxD9QhMItNoiwIDRUOQ2WlIAikQUijJapj8U19iSVLpZCoidI9L0KvJ5EqdQTNEovpzxuEplFZmKcltJaiSio9MpKtVavVGs01S8MV07I4fJoLiojaMuaaAZxuECIOL8jtQHs8WT5fI7KY3eYrLYsU4XColIZFNofP4mca-jysNHkVK7cYKlUanUbA0mpS1XUvXp3DZatVc7JFIy-EA */createMachine({description: "made by @erikras",initial: "Mounted",states: {Mounted: {entry: ["constructor","getDerivedStateFromProps","render","componentDidMount",],initial: "Rendered",states: {Rendered: {},},on: {Unmount: {actions: "componentWillUnmount",target: "Unmounted",},"New Props": {actions: ["getDerivedStateFromProps", "render", "componentDidUpdate"],cond: "shouldComponentUpdate",target: ".Rendered",},"Set State": {actions: ["render", "componentDidUpdate"],cond: "shouldComponentUpdate",target: ".Rendered",},"Force Update": {actions: ["render", "componentDidUpdate"],target: ".Rendered",},},},Unmounted: {type: "final",},},id: "React Component",});
The crazy comment at the top is how the visual editor encodes the location of all the boxes and arrows and whatnot, so if you open this exact file in the editor, the layout will be the same. Clever, huh?
Of course, because I tweeted it, I got a clever response/challenge, from my friend, Donovan:
Nice. Now do this one.
with a link to this chart he, his son, and Dan put together three years ago:

I couldn't turn down such a challenge, now could I?
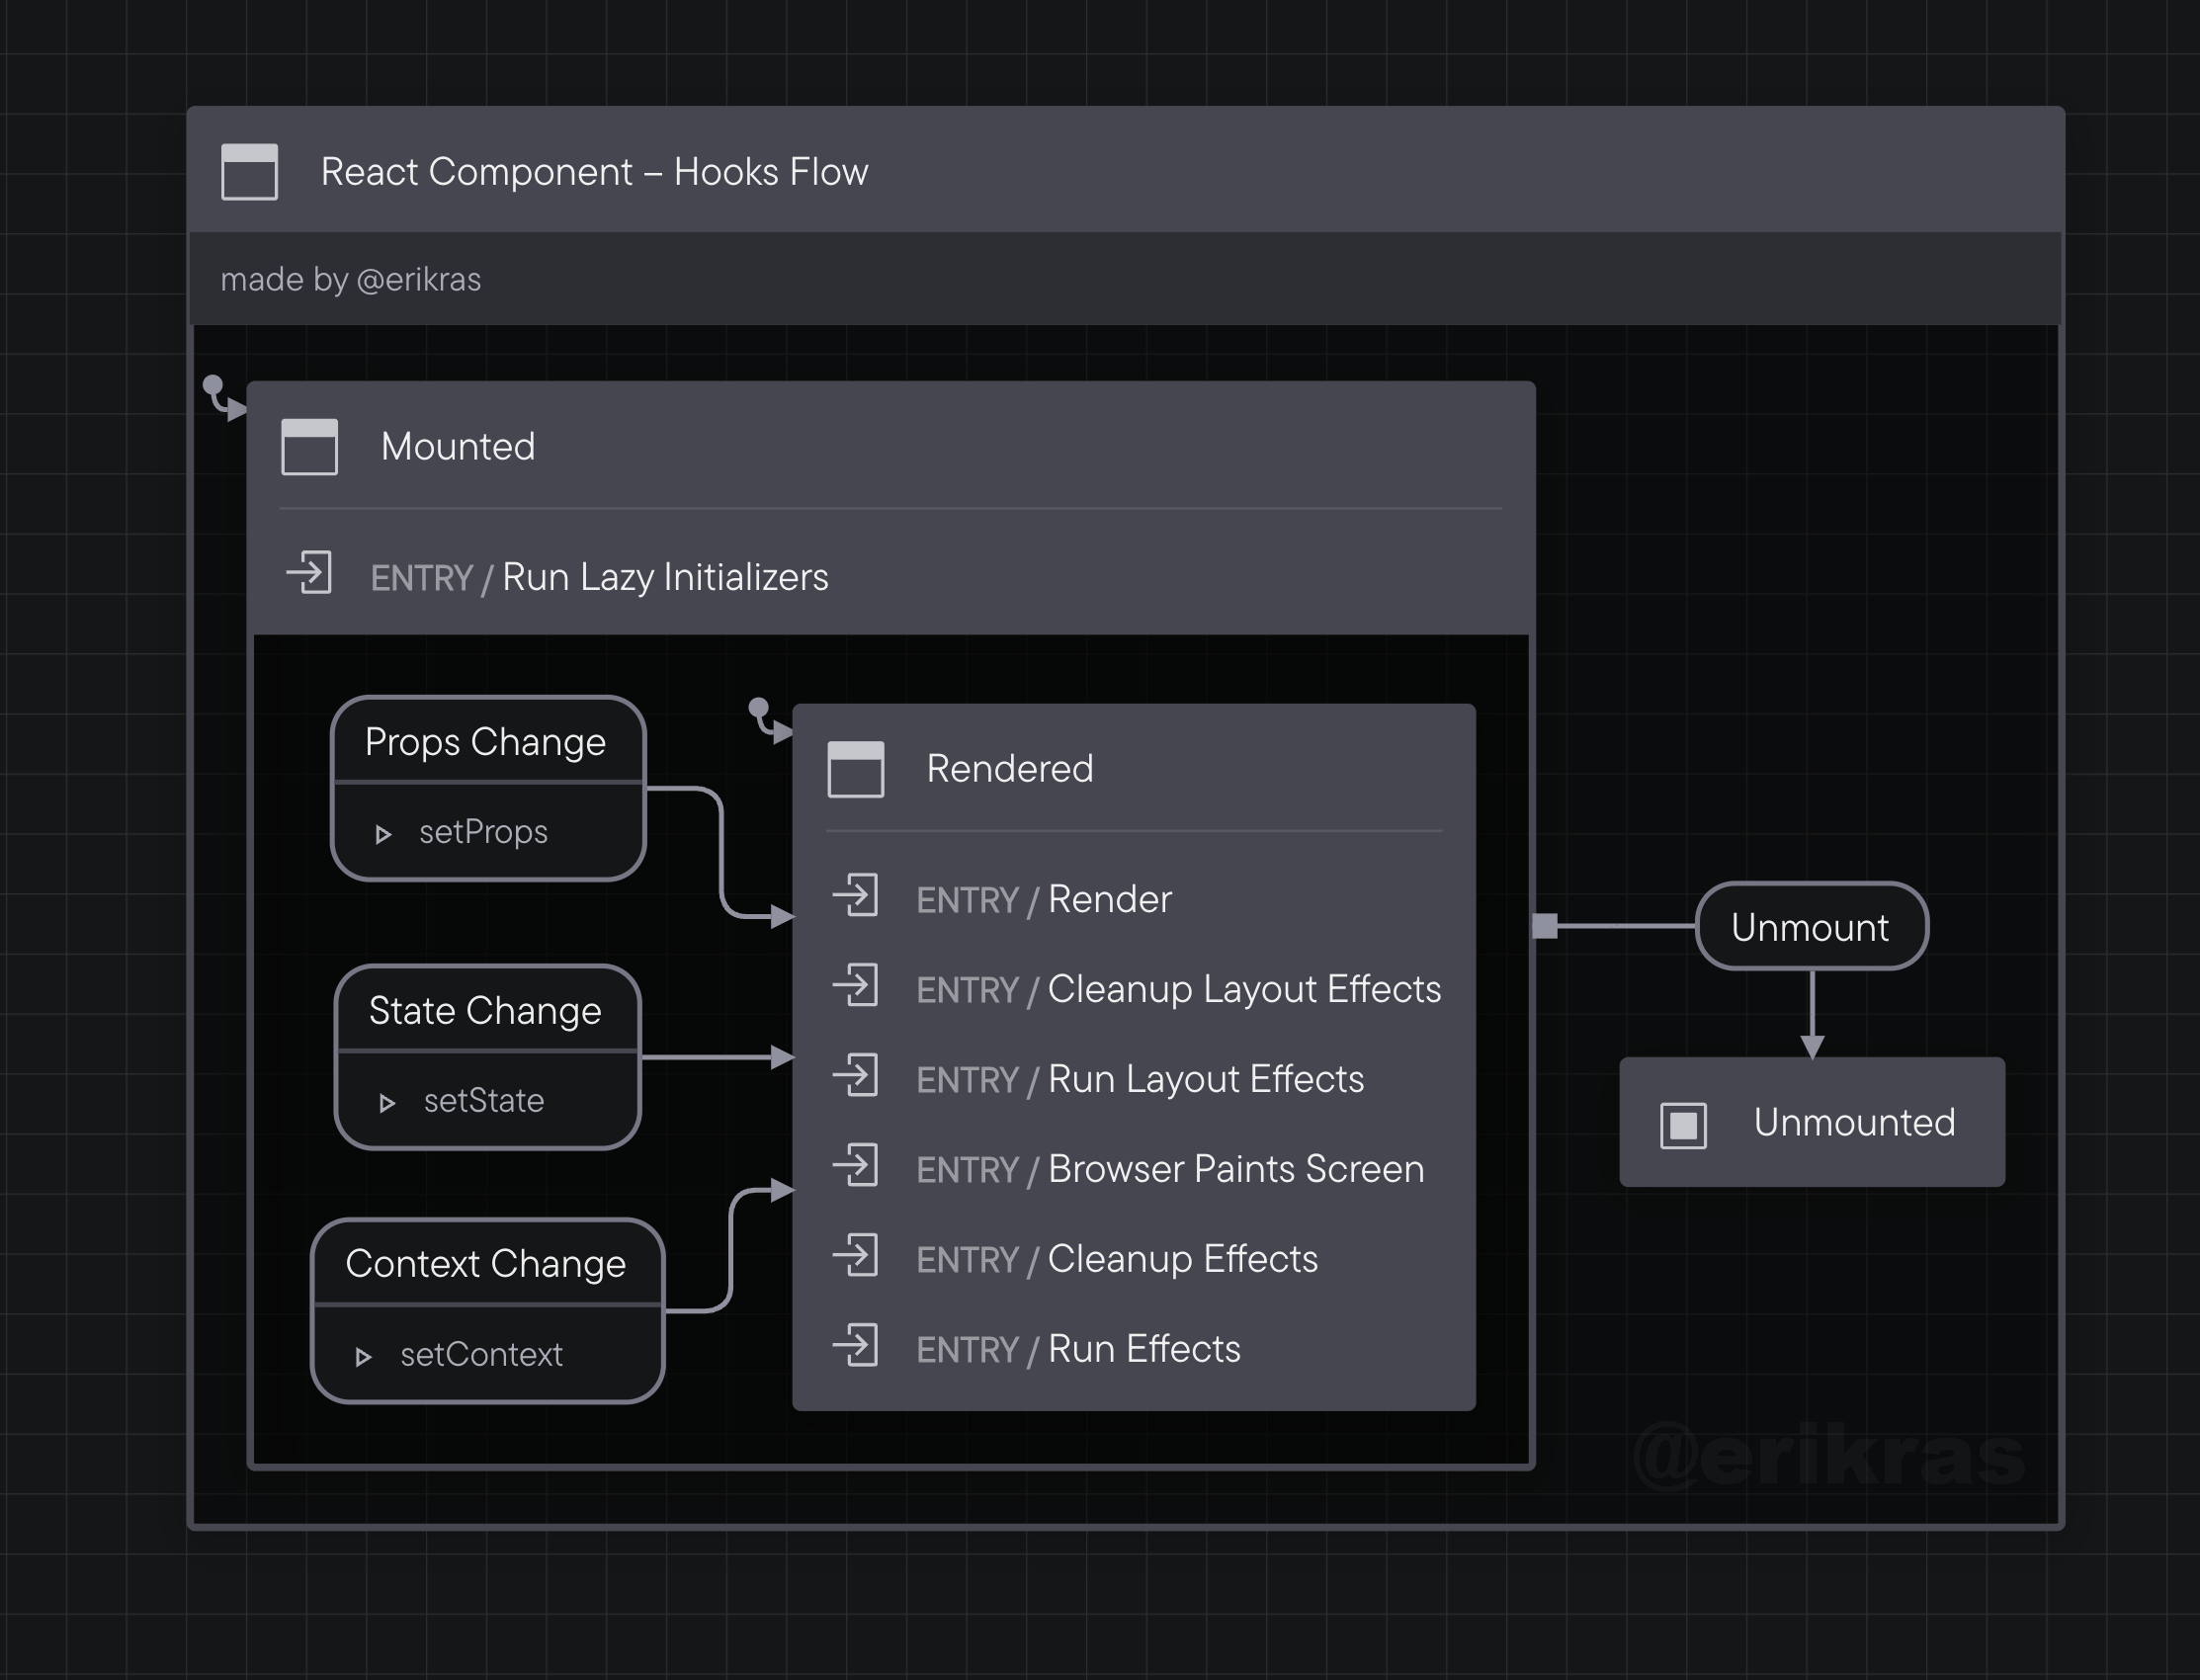
React Hooks State Chart
It actually didn't take me long at all to whip up this one. Although React hooks, as an API, is full of footguns with which to shoot yourself, the actual mental model of what is happening is simpler than the lifecycle methods.

With this one, I took the additional step of imagining we were actually implementing it as an XState state machine, where we could have to save the props, state, and context into the machine's context (that's the XState term for the internal storage of the machine).
The Code
import { assign, createMachine } from "xstate";export default /** @xstate-layout N4IgpgJg5mDOIC5QCUwEMDGAXABAYQHsBbABwIDsxzdBkAhwAkCCBrWHAMQBsCB3AOgCyBAK7VIfVOQhgATpADEABRkESbPAAs05GIlBlYASyyGKekAA9EAWgAsAdgAMfewGYAnK9e3XARgBs7v6OrgA0IACeNvYATPZ8tgAcMX7BjgH+9r4AvtnhqJi4hKQUVLQMTKwc3PxColjiktJyEPIAylhoDfhaOmDmBsam5OZWCHb+iXzuvgCsvr6J7rY+7u724VHj-r7u0zGJib5uwa7+B7n56Nj4xGSU1Dh0jCxsXLyCImIQElTNCoQxBYir1dEgQIMTGZwWM7PYpnEVolzjFbLNXEdNjZ5lMfPYso5-LZHGtZjFLiACjdivcyk8Kq9qh86t95ABVchEL5YAYEIxQkYwxD2WZ8SaxWKuRwxYJJXxY7Zk6azFU7HZJFX2XJ5EDkAjSeDgqlFO6lR7PSpvGqfeqNP6ySC8-nDUY2A6uaZHEW+Ry+1zo1wbSLRGIxBIHI7pUNrGUU423EoPcovKrvWrcx3gyEuoXjWbSviIpIotEY+XB8aJeYJZKpX0ZLJx64mxN0i2MtN8Dlc20QJ1DaGgMa2fx8ZFSvy+Ym+QOzWwK6yzI58RxkxyJJKuGJT3ZNwoJ2nmhmpmr9gWuvMywv2JEl9GYivWIK+GspUMi-xz-za7JAA */createMachine({description: "made by @erikras",initial: "Mounted",context: {props: {},state: {},context: {},},states: {Mounted: {entry: "Run Lazy Initializers",initial: "Rendered",states: {Rendered: {entry: ["Render","Cleanup Layout Effects","Run Layout Effects","Browser Paints Screen","Cleanup Effects","Run Effects",],on: {"Props Change": {actions: "setProps",},"State Change": {actions: "setState",},"Context Change": {actions: "setContext",},},},},on: {Unmount: {target: "Unmounted",},},},Unmounted: {type: "final",},},id: "React Component – Hooks Flow",},{actions: {setContext: assign({ props: (_context, event) => event.props }),setProps: assign({ props: (_context, event) => event.props }),setState: assign({ props: (_context, event) => event.props }),},});
Conclusion
Am I trying to reimplement React using state machines? Hell no!
But this exercise has served to benefit my understanding – and maybe yours too? – of how React works, how to model flows in state charts using Stately's visual editor, and how to read and understand state charts.